Cloud Cost Observability와 FinOps
How to connect technology and budget decisions through unit-of-service cost visualization

Introduction
Cloud costs are usually checked at the end of the month and responded to the following month. This method is already too late. Signs of cost abnormalities can be prevented by looking at them on the same time axis as technical indicators. The key to FinOps is decision-making speed, not savings technology.
This article describes a practical method for treating “cost events like operational events” by linking cost data to service operation metrics.
Problem definition
Why cost operations fail in most organizations:
- Cost data is only on an account/resource basis and is not linked to the service manager.
- Traffic changes and cost changes are not viewed on the same dashboard.
- The effect before and after applying the Reserved/Savings Plan is not measured on an experimental basis.
- There is a monthly report, but there is no real-time warning system.
The key is to operate a set of tagging standards + cost allocation model + real-time warning system.
Key concepts
| layer | Question | Standards of Practice |
|---|---|---|
| Tagging | Whose Cost is it | service, env, owner, cost_center required |
| Allocation | How to allocate | Specifying common cost distribution rules |
| Budget | At what line should we warn | Day/Week/Month Threshold Separation |
| Optimization | What to reduce first | Based on total cost impact rather than unit price |
The starting point for cost optimization is not discount purchasing, but “visibility consistency.”
Code Example 1: Service Cost Aggregation SQL
WITH base AS (
  SELECT
    usage_date,
    tags->>'service' AS service,
    tags->>'env' AS env,
    sum(unblended_cost) AS cost_usd
  FROM billing_line_items
  WHERE usage_date >= current_date - interval '14 days'
  GROUP BY 1, 2, 3
)
SELECT
  usage_date,
  coalesce(service, 'unknown') AS service,
  coalesce(env, 'unknown') AS env,
  round(cost_usd::numeric, 2) AS cost_usd
FROM base
ORDER BY usage_date DESC, cost_usd DESC;
Code Example 2: Cost Alert Policy Example
budget_policies:
  - name: service-daily-burst
    scope: service
    threshold_usd: 300
    window: 1d
    action:
      - slack:#finops-alert
      - create_issue:platform-cost

  - name: prod-weekly-growth
    scope: env=prod
    growth_rate_threshold: 0.25
    window: 7d
    action:
      - notify:owner
      - require_review:true
Architecture flow
Tradeoffs
- Detailed tagging rules increase accuracy, but place an input burden on the development team.
- If a strong real-time warning is applied, noise may increase, so threshold tuning is necessary.
- Since public cost distribution cannot be completely fair, it is practical to give priority to “agreed simple rules.”
Cleanup
FinOps is an operating system, not a cost-cutting project. By viewing service metrics and cost metrics in the same loop, cost issues can be addressed as part of daily operations rather than as an end-of-month report. As a result, technology decisions and budget decisions speak the same language.
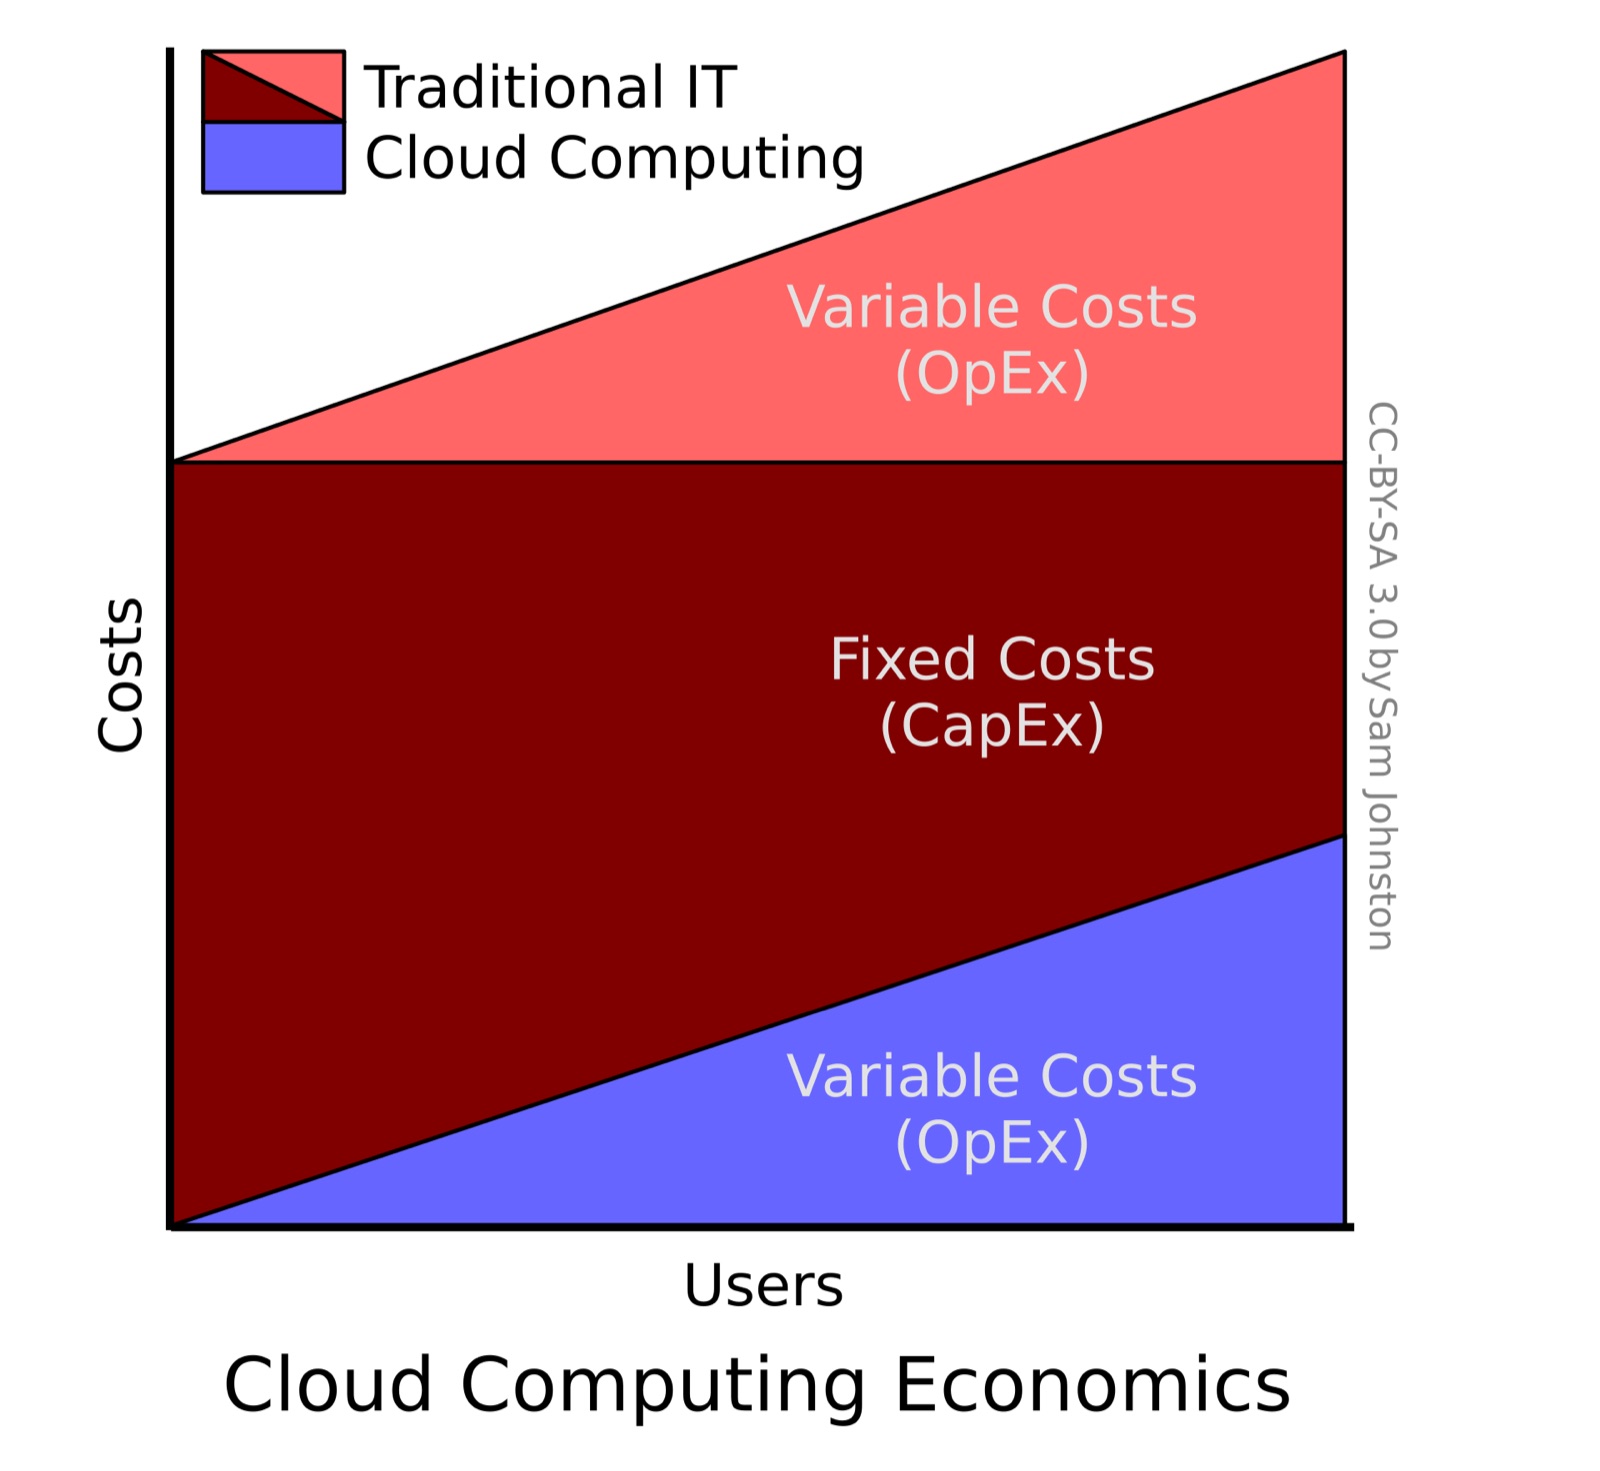
Image source
- Cover: source link
- License: CC BY-SA 3.0 / Author: Sam Johnston
- Note: After downloading the free license image from Wikimedia Commons, it was optimized to JPG at 1600px.